Automatic Time Tracking using Node.js
In this tutorial you will learn how to build a automatic time tracking system in Node.js. You will also build a GUI with charts to display data using Chart.js.
Requirments to follow along
Node.js needs to be installed, if you don't have it go to Node.js and follow the instructions on how to install. (This tutorial works with node version 14)
Application Features
- Detect the current active window, and read meta information.
- Track the time spent in each program.
- Store all timed tracked in a JSON file.
- Serve a webserver, send back content when the user visits.
- Display a circle diagram that shows how all time was distributed.
- Display a table with more detail about every program.
- Create a link when URL is available, for example a webpage in google chrome.
After completing this tutorial you will have a project that looks something like this.
![]()
Installation
Open up a terminal window and run the following commands.
mkdir node-automatic-tracking
cd node-automatic-tracking
npm init -y
Here we create a new directory and initialize a package.json file.
Run the following command to install our dependencies.
npm install active-win@6.1.0 express@4.17.1 hbs@4.1.1 lodash@4.17.15 fs-extra@9.0.0To ensure compatibility with this tutorial use specified versions.
Dependency overview for server/tracking application
- active-win Get metadata about the active window, works for Windows, Linux and Mac.
- express Minimal Node.js web application framework.
- hbs Template system for node.
- lodash Utils library for JavaScript.
- fs-extra Adds extra fs methods and promise support.
We also have some dependencies for the frontend but we will come back to them later.
Getting meta about the active window
This seems like a tricky one how can we do it solve it? turn out there is already a package that will do all the heavy lifting for us.
Start by creating a file called ActivityTracker.js and add the following code.
const activeWin = require('active-win');
(async () => {
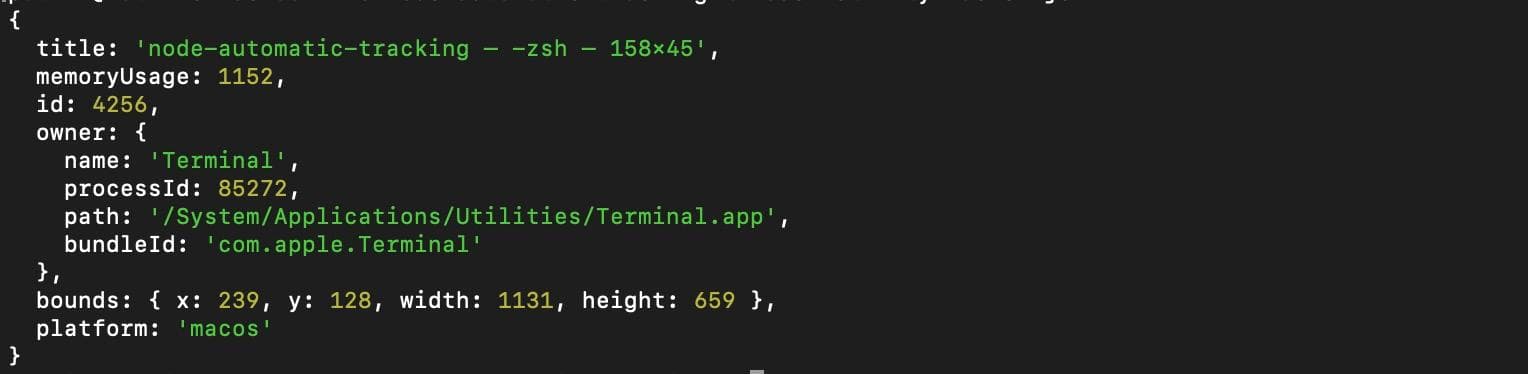
console.log(await activeWin());
})();If you now run node Activitytracker.js in the terminal you should see information about the active window.
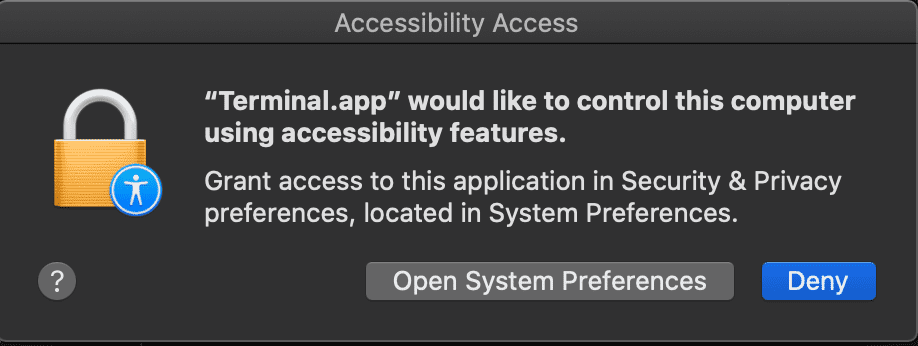
If you are on a mac you might get some trouble with permission. In security and privacy settings you have to allow screen recording and accessibility for the terminal.
The script terminates after it ran. How can we keep it alive and detect when the active window is changed?
In Node.js if the event loop is empty it will automatically exit, by adding a recurring event we can prevent that. Update ActivityTracker.js with this code.
const activeWin = require('active-win');
setInterval(async () => {
  const window = await activeWin();
  console.log(window);
}, 2000);
Cancel the currently running app and run node ActivityTracker.js in the terminal.
You will see a new output in the terminal every 2000 ms, try to set another application as active for example google chrome and the output will be different.
Building our activity tracker
To keep code more organized we will refactor this to use a class. Update ActivityTracker.js with the following code.
const activeWin = require('active-win');
const fs = require('fs-extra');
const _ = require('lodash');

class ActivityTracker {
  constructor (filePath, interval) {
    this.filePath = filePath;
    this.interval = interval;
    this.start = null;
    this.app = null;
  }

  track () {
    setInterval(async () => {
      const window = await activeWin();
    }, this.interval);
  }
}

module.exports = ActivityTracker;
We require our dependencies after that we create a class with a constructor and move our previous code inside a method called track. We also replace the hardcoded value 2000 with this.interval, that we later will set when we Initialize the constructor.
Here is an overview of what the different properties are used for.
- filepath Location of where we will store the JSON file for tracked time.
- interval How often we should check what window is active.
- start Date of when the active application got tracked.
- app An object containing information about the currently tracked application.
The next step will be to store information about the active application and a start date. Update track with the following code.
track () {
  setInterval(async () => {
    const window = await activeWin();

    if (!this.app) {
      this.start = new Date();
      this.app = window;
    }

    if (window.title !== this.app.title) {
      await this.storeData();
      this.app = null;
    }
  }, this.interval);
}
First, we call activeWin and wait for the results, if this.app is not set we set this.start to the current date and this.app to the current window.
If the previous title is not equal to the current window that means we have switched to another window and we should save that data. We do that by calling a method this.storeData (we will create this method next), as the last step, we reset this.app so we can track a new window.
Create a method called storeData and add this code.
async storeData () {
  const content = await fs.readJson(this.filePath);
  const time = {
    start: this.start,
    end: new Date()
  };
  const { url, owner: { name }, title } = this.app;

  _.defaultsDeep(content, { [name]: { [title]: { time: 0, url } } });

  content[name][title].time += Math.abs(time.start - time.end) / 1000;

  await fs.writeJson(this.filePath, content, { spaces: 2 });
}
We start with reading our JSON file. After that, we create a time object that has a start and end date. To make our code more readable we destruct the properties from this.app
By using defaultsDeep we can set default values if they do not exist to avoid errors.
We calculate the difference between the start and the end date to get how much time we spent. This will be in milliseconds so to store it in seconds we just have to divide it with 1000.
The last step is to save it to the JSON file. By passing { spaces: 2 } we can make sure it's saved in a much more readable way.
Now create a method called Init this method will be called on startup.
async init () {
  const fileExists = await fs.pathExists(this.filePath);

  if (!fileExists) {
    await fs.writeJson(this.filePath, {});
  }

  this.track();
}
It just checks if the JSON file exists, if it does not create it with an empty object. After that start tracking.
Last method is getChartData.
async getChartData () {
  const data = await fs.readJson(this.filePath);
  const formatedData = [];

  Object.entries(data).forEach(([key, val]) => {
    const programs = [];
    let totalTimeOnApp = 0;

    Object.entries(val).forEach(([prop, meta]) => {
      totalTimeOnApp += meta.time;
      programs.push({
        name: prop,
        url: meta.url,
        time: meta.time
      });
    });

    formatedData.push({
      title: key,
      total: Math.floor(totalTimeOnApp),
      data: programs
    });
  });

  return formatedData;
}
Here we read the data from our JSON file and transform it to make it easier for the frontend to iterate over and display it in a graph. (We will build that later).
Here is the full code for ActivityTracker.js
const activeWin = require('active-win');
const _ = require('lodash');
const fs = require('fs-extra');

class ActivityTracker {
  constructor (filePath, interval) {
    this.filePath = filePath;
    this.interval = interval;
    this.start = null;
    this.app = null;
  }

  async getChartData () {
    const data = await fs.readJson(this.filePath);
    const formatedData = [];

    Object.entries(data).forEach(([key, val]) => {
      const programs = [];
      let totalTimeOnApp = 0;

      Object.entries(val).forEach(([prop, meta]) => {
        totalTimeOnApp += meta.time;
        programs.push({
          name: prop,
          url: meta.url,
          time: meta.time
        });
      });

      formatedData.push({
        title: key,
        total: Math.floor(totalTimeOnApp),
        data: programs
      });
    });

    return formatedData;
  }

  async storeData () {
    const content = await fs.readJson(this.filePath);
    const time = {
      start: this.start,
      end: new Date()
    };
    const { url, owner: { name }, title } = this.app;

    _.defaultsDeep(content, { [name]: { [title]: { time: 0, url } } });

    content[name][title].time += Math.abs(time.start - time.end) / 1000;

    await fs.writeJson(this.filePath, content, { spaces: 2 });
  }

  async init () {
    const fileExists = await fs.pathExists(this.filePath);

    if (!fileExists) {
      await fs.writeJson(this.filePath, {});
    }

    this.track();
  }

  track () {
    setInterval(async () => {
      const window = await activeWin();

      if (!this.app) {
        this.start = new Date();
        this.app = window;
      }

      if (window.title !== this.app.title) {
        await this.storeData();
        this.app = null;
      }
    }, this.interval);
  }
}

module.exports = ActivityTracker;
So far a lot of coding but not much on the screen, let's make something happen.
Create a file called app.js with the following code.
const ActivityTracker = require("./ActivityTracker");
const activityTracker = new ActivityTracker("tracking.json", 2000);
activityTracker.init();
if you now run node app.js and try to switch between applications, a file called tracking.json should have been created containing tracked time.
The data will be structured something like this, your application data will probably be different but the structure will be the same.
{
  "Terminal": {
    "node-automatic-tracking — node app.js — 121×28": {
      "data": 6.019
    }
  },
  "Code": {
    "ActivityTracker.js — node-automatic-tracking": {
      "data": 18.065
    },
    ".eslintrc — node-automatic-tracking": {
      "data": 22.542
    },
    "index.hbs — node-automatic-tracking": {
      "data": 12.191
    }
  },
  "Google Chrome": {
    "Write JavaScript - Write JavaScript": {
      "data": 22.547,
      "url": "https://writejavascript.com/"
    },
    "Examine, modify, and watch variables - Firefox Developer Tools | MDN": {
      "data": 34.567,
      "url": "https://developer.mozilla.org/en-US/docs/Tools/Debugger/How_to/Examine,_modify,_and_watch_variables"
    },
    "Stack Overflow - Where Developers Learn, Share, & Build Careers": {
      "data": 32.948,
      "url": "https://stackoverflow.com/"
    }
  }
  "Spotify": {
    "Spotify Premium": {
      "data": 58.632
    }
  },
  "Notes": {
    "Notes": {
      "data": 16.51
    }
  }
}
Every application would have its own keys with children containing extra data. For example different websites in google chrome.
Creating the UI
Update app.js with this code.
const path = require("path");
const express = require("express");
const app = express();
const port = 3000;

const ActivityTracker = require("./ActivityTracker");
const activityTracker = new ActivityTracker("tracking.json", 2000);
activityTracker.init();

app.use("/public", express.static(path.join(__dirname, "/public")));
app.set("views", path.join(__dirname, "views"));
app.set("view engine", "hbs");

app.get("/", async (req, res) => {
  const chartData = await activityTracker.getChartData();
  res.render("index", {
    encodedJson: encodeURIComponent(JSON.stringify(chartData)),
  });
});

app.listen(port, () => console.log(`Listening on port ${port}!`));
Here we create an express app, start trackng, set up a public directory and specify handlebars to be our template engine. After that, we set up a route for a view called index, and pass our chartData. We have to encode it to make it available for client JavaScript. Last we tell express to listen to our port variable.
Create a new folder called public with a main.js file inside, also create a folder called views with a file index.hbs inside.
You show now have a file structure that looks like this.
📦activewindow
 ┣ 📂public
 ┃ ┗ 📜main.js
 ┣ 📂views
 ┃ ┗ 📜index.hbs
 ┣ 📜ActivityTracker.js
 ┣ 📜app.js
 ┣ 📜package-lock.json
 ┗ 📜package.json
Inside index.hbs add the following code.
<!DOCTYPE html>
<html lang="en">
  <head>
    <meta charset="UTF-8" />
    <meta name="viewport" content="width=device-width, initial-scale=1.0" />
    <link
      rel="stylesheet"
      href="https://unpkg.com/bootstrap-table@1.15.4/dist/bootstrap-table.min.css"
    />
    <link
      rel="stylesheet"
      href="https://unpkg.com/bootstrap@4.3.1/dist/css/bootstrap.min.css"
    />
    <title>Activity Tracker</title>
  </head>
  <body>
    <div class="container">
      <h1 class="my-5 text-center">
        Time tracking app
      </h1>
      <div class="row">
        <div class="col-5">
          <canvas width="400" height="400" id="chart"></canvas>
        </div>
        <div class="col-7">
          <h2 id="table-title">
            Select a chart to show data
          </h2>
          <table id="table" class="table"></table>
        </div>
      </div>
    </div>
    <script src="https://unpkg.com/jquery@3.3.1/dist/jquery.slim.min.js"></script>
    <script src="https://unpkg.com/bootstrap@4.3.1/dist/js/bootstrap.min.js"></script>
    <script src="https://unpkg.com/chart.js@2.8.0/dist/Chart.min.js"></script>
    <script src="https://unpkg.com/bootstrap-table@1.15.4/dist/bootstrap-table.min.js"></script>
    <script>
      const decodedJson = decodeURIComponent("{{{encodedJson}}}");
    </script>
    <script src="public/main.js"></script>
  </body>
</html>
Here we load our dependencies. To make it simple we load everything from a CDN however if you would like to load it with npm you can do that.
We have some basic HTML with bootstrap classes, what it does is to set up some structure with one row and two columns.
In one of the columns we have a canvas, this is where the chart will go and in the next column, we will display a table with details of the selected application.
You might be wonder what this line is doing
<script> const decodedJson = decodeURIComponent("{{{encodedJson}}}");</script>
We take our data that we passed from express to handlebars and to make it accessible by client JavaScript, this is how you can do it.
After that we include main.js, make sure this script tag is placed last.
In main.js let's add the code to render the chart and the table.
Inside public/main.js add this code.
(() => {
  const formatName = (value, row) =>
    row.url ? `<a target="_blank" href="${row.url}">${value}</a>` : value;
  const formatTime = (value) => secondsToHms(value);
  const secondsToHms = (d) => {
    d = Number(d);
    const h = Math.floor(d / 3600);
    const m = Math.floor((d % 3600) / 60);
    const s = Math.floor((d % 3600) % 60);

    const hDisplay = h > 0 ? h + (h === 1 ? " hour, " : " hours, ") : "";
    const mDisplay = m > 0 ? m + (m === 1 ? " minute, " : " minutes, ") : "";
    const sDisplay = s > 0 ? s + (s === 1 ? " second" : " seconds") : "";
    return hDisplay + mDisplay + sDisplay;
  };

  const columns = [
    {
      field: "name",
      title: "name",
      formatter: formatName,
      sortable: true,
    },
    {
      field: "time",
      title: "time",
      formatter: formatTime,
      sortable: true,
    },
  ];

  const chartData = JSON.parse(decodedJson);
})();
First, we wrap everything in an immediately invoked function, this prevents polluting the global scope. We specify our columns and set them to be sortable, we also add formatters. One to display the time in a more readable way and one to wrap the value in a link if it has URL.
SecondsToHms will be used to display time in hours, minutes, seconds
For example
secondsToHms(70); // 1 minute, 10 secondslast we parse our chartData received from express.
Below chartData variable in main.js add this code.
const ctx = document.getElementById("chart").getContext("2d");
new Chart(ctx, {
  type: "doughnut",
  data: {
    datasets: [
      {
        data: chartData.map((data) => data.total),
        backgroundColor: ["#919ACB", "#7FC3E8"],
      },
    ],
    labels: chartData.map((chart) => chart.title),
  },
});
This code comes from the library Chart.js, first, the canvas element is selected and we create a Chart instance and tell it to be of type doughnut and pass our chart data to it.
If you run node app.js you can now go to http://localhost:3000 in your browser, you should see a circle diagram. It's possible to hover over the diagram but other than that it's quite boring. Let's add some functionality when clicking one of the diagram elements.
The idea is to display some details in a table when an interaction is made.
Update main.js with the following code.
(() => {
  const formatName = (value, row) =>
    row.url ? `<a target="_blank" href="${row.url}">${value}</a>` : value;
  const formatTime = (value) => secondsToHms(value);
  const secondsToHms = (d) => {
    d = Number(d);
    const h = Math.floor(d / 3600);
    const m = Math.floor((d % 3600) / 60);
    const s = Math.floor((d % 3600) % 60);

    const hDisplay = h > 0 ? h + (h === 1 ? " hour, " : " hours, ") : "";
    const mDisplay = m > 0 ? m + (m === 1 ? " minute, " : " minutes, ") : "";
    const sDisplay = s > 0 ? s + (s === 1 ? " second" : " seconds") : "";
    return hDisplay + mDisplay + sDisplay;
  };

  const columns = [
    {
      field: "name",
      title: "name",
      formatter: formatName,
      sortable: true,
    },
    {
      field: "time",
      title: "time",
      formatter: formatTime,
      sortable: true,
    },
  ];

  const chartData = JSON.parse(decodedJson);
  const ctx = document.getElementById("chart").getContext("2d");

    const renderTableData = (chart, columns) => {
    const table = $("#table");

    $("#table-title").text(
      chart.title + " (" + secondsToHms(chart.total) + ")"
    );

    if (table.children().length) {
      return table.bootstrapTable("load", chart.data);
    }

    table.bootstrapTable({
      columns,
      data: chart.data,
    });
  };

  const graphClickEvent = (event, array) => {
    if (!array.length) {
      return;
    }
    renderTableData(chartData[array[0]._index], columns);
  };

  new Chart(ctx, {ç
    type: "doughnut",
    data: {
      datasets: [
        {
          data: chartData.map((data) => data.total),
          backgroundColor: ["#919ACB", "#7FC3E8"],
        },
      ],
      labels: chartData.map((chart) => chart.title),
    },
    options: {
      onClick: graphClickEvent,
    },
  });
})();
We create a function to render the table with our data, Bootstrap Table which we included before makes this very easy. Just supply the data and Bootstrap Table will do the heavy work.
Then we have graphClickEvent this will make sure we call the render function when the diagram is clicked. So for example, if we switch from Spotify to Google Chrome new data should be displayed.
If you now visit http://localhost:3000 you should be able to click the different parts of the diagram and it will render application details in the table.
At the moment we have hardcoded two colors for the diagram, we probably gonna have more than 2 applications showing so let's fix that. Add the following two functions under secondsToHms.
const dynamicColors = () => {
    const r = Math.floor(Math.random() * 255);
    const g = Math.floor(Math.random() * 255);
    const b = Math.floor(Math.random() * 255);

    return `rgba(${r},${g},${b},0.5)`;
};

const poolColors = size => {
  const pool = [];
  for (let i = 0; i < size; i++) {
    pool.push(dynamicColors());
  }
  return pool;
};
The first method will generate a random color and the second method will return an array with dynamic colors, and as argument we pass a number of how many colors we should get back.
All we need to do is replace backgroundColor: ["#919ACB", "#7FC3E8"], with backgroundColor: poolColors(chartData.length),
The code for main.js should look like this.
(() => {
  const formatName = (value, row) =>
    row.url ? `<a target="_blank" href="${row.url}">${value}</a>` : value;
  const formatTime = (value) => secondsToHms(value);
  const secondsToHms = (d) => {
    d = Number(d);
    const h = Math.floor(d / 3600);
    const m = Math.floor((d % 3600) / 60);
    const s = Math.floor((d % 3600) % 60);

    const hDisplay = h > 0 ? h + (h === 1 ? " hour, " : " hours, ") : "";
    const mDisplay = m > 0 ? m + (m === 1 ? " minute, " : " minutes, ") : "";
    const sDisplay = s > 0 ? s + (s === 1 ? " second " : " seconds") : "";

    return hDisplay + mDisplay + sDisplay;
  };

  const dynamicColors = () => {
    const r = Math.floor(Math.random() * 255);
    const g = Math.floor(Math.random() * 255);
    const b = Math.floor(Math.random() * 255);

    return `rgba(${r},${g},${b},0.5)`;
  };

  const poolColors = (size) => {
    const pool = [];

    for (let i = 0; i < size; i++) {
      pool.push(dynamicColors());
    }
    return pool;
  };

  const columns = [
    {
      field: "name",
      title: "name",
      formatter: formatName,
      sortable: true,
    },
    {
      field: "time",
      title: "time",
      formatter: formatTime,
      sortable: true,
    },
  ];

  const chartData = JSON.parse(decodedJson);
  const ctx = document.getElementById("chart").getContext("2d");

  const renderTableData = (chart, columns) => {
    const table = $("#table");

    $("#table-title").text(`${chart.title} (${secondsToHms(chart.total)})`);

    if (table.children().length) {
      return table.bootstrapTable("load", chart.data);
    }

    table.bootstrapTable({
      columns,
      data: chart.data,
    });
  };

  const graphClickEvent = (event, array) => {
    if (!array.length) {
      return;
    }
    renderTableData(chartData[array[0]._index], columns);
  };

  new Chart(ctx, {
    type: "doughnut",
    data: {
      datasets: [
        {
          data: chartData.map((data) => data.total),
          backgroundColor: poolColors(chartData.length),
        },
      ],
      labels: chartData.map((chart) => chart.title),
    },
    options: {
      onClick: graphClickEvent,
    },
  });
})();
Closing notes
I hope you enjoyed this guide and hopefully, you learned something new. There is a lot of room to improve this application. Some ideas would update the chart in real-time without having to reload. Create a function that exports all data to a CSV.
If you would like to deploy this application you should separate the tracking script and the express server. So for example, you would deploy the express server on Digital Ocean and have the tracking script on your local computer, then you could add an endpoint where you send data between those applications.
Source code can be found at https://github.com/patni1992/Automatic-Time-Tracking-Using-Node